Thursday, November 21, 2013

A Peloton Palette


In August I took video of a number of track races at the B.C. Provincial championships. I was able to get very good video of two races in particular, the women's points-race, and the women's scratch race.  


                               Figure 1. Women's points race. 2013 B.C. Provincial championships

The two graphs below contain data from the women's points race. The top graph shows the positional changes for each of fourteen cyclists; the lower graph shows peloton speed.

The values on the left indicate the relative position of the rider: the closer to 1, the farther toward the back of the pack the cyclist is.  The closer to 0, the closer to the front the cyclist is. So, we can imagine the pack as facing downward on the page.  Ignoring the letters at the top for now (which indicate peloton phases, which I do not discuss in this post), we can see that regions where curves are most dense are periods when there was high positional change among the riders.  The regions where curves are straight and horizontal are periods when the riders maintained stable positions (i.e. they "held" their positions during these periods). 

The graph tracks very nicely how riders within the group shifted their positions relative to each other, determined simply by counting the number of riders ahead, not counting riders directly beside each other, divided by the total for a ratio <1. It is a very useful method of indicating phases of peloton dynamics. The graphs combined are a very nice static representation of an entire race, and if we follow each curve individually or pick one or two at random, we get a good sense of how they moved in the pack over the course of the race. 

    Figure 2. Top graph shows positional change among 14 cyclists. Letters at top indicate phases and sub-
    phases (not discussed in this post). The squiggly arrow at the top shows a rider who had been lapped.


Now below is a positional change graph for 16 cyclists from my Peloton 5.5. simulation. (See Figure 8 for an enlarged view of a typical simulated peloton). We can see similar regions of high positional change and periods of stability. Here the periods of stability are comparatively long-term.


     Figure 3.  Positional change for 16 simulated cyclists (PCR .49) for roughly 7 minutes of run time.


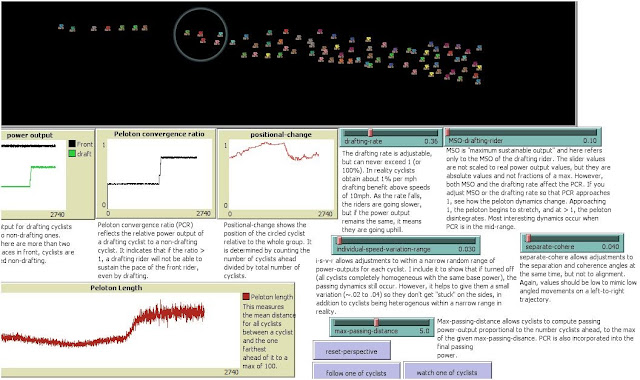
For context, below is a graph tracking one single cyclist's positional change looks like. The circle shows the cyclist being tracked, and the red graph in the middle shows its positional change over time. The curve shows how the rider started near the front of the group, gradually shifted toward the back, and then gradually shifted toward the front again. 


    Figure 4. Tracking positional change of one simulated cyclist.  There are 200 simulated riders in the
    peloton above. Red curve shows positional change of rider in circle. 


Below is a similar graph tracking 50 of 60 simulated cyclists. It is much richer, and again we can clearly see regions of high positional change and period of stability, as well as mixed phases. 

Figure 5. Positional change for 48 simulated cyclists. 


To me it is somewhat reminiscent of a Jackson Pollock abstract painting, perhaps a little like the one in Figure 6. Interestingly, Jackson Pollock paintings have been found to contain fractal patterns. Here is a link to Marcus du Satoy's discussion of this topic.  http://www.youtube.com/watch?v=sDXMRN2IZq4


                                            Figure 6. Jackson Pollock painting 


In Figure 5 and 7 (below), we may consider mixed phases as containing "eddies", in that there are subsets of cyclists within the group who are exchanging positions, while others are holding their positions. There are gaps in the graph, which indicate regions when riders were side-by-side. As in the real life graph (Fig 2), when cyclists were directly side-by-side, they were not counted as being ahead or behind. So side-by-side riders have the same position value - these appear as "holes" is in the graph. Where we see regions of long-range diagonal movement among most of the cyclists, this indicates whole peloton rotations, much like the convection pattern I have spoken of in previous blogs, and as Erick Ratamero presented evidence for in his paper (3).


  Figure 7. Positional change for 50 of 60 cyclists, roughly 10 minutes of run time. Note the clear transitions
  between periods of high positional change periods of stability.


                                Figure 8. Enlarged view of typical peloton from my Peloton 5.5
                                model (version slightly modified from that presented in my paper "Peloton phase
                                oscillations"

I believe we are bound to see similar kinds of patterns and transitions of high positional change and low positional change in a large variety of collective phenomena. What palettes of positional change may we find among other such collectives? Where else will find the Jackson Pollocks of nature, embedded deeply within the patterns of collective interaction?

Of particular interest to me of course are American coot collectives, and I hope to do some additional research regarding coots this winter. The challenge for natural collectives like coots, or flocks of starlings or geese, for example, is in obtaining video or other data that can be accurately analyzed for positional change among flock members. Not easy among three dimensional flocks from great distances, but possible with the right conditions.


                               Figure 9. Coots on Elk lake (5)


References

1. Marcus du Satoy  http://www.youtube.com/watch?v=sDXMRN2IZq4

2. Pollock, Jackson. 1952.  "Blue-Poles" http://www.dailyartfixx.com/tag/jackson-pollock/

3. Ratamero, Erick. 2013. MOPED : an agent-based model for peloton dynamics in competitive cycling
In: International Congress on Sports Science Research and Technology Support, 2013, Vilamoura, icSPORTS 2013

4. Trenchard, H. 2013. Peloton phase oscillations. Chaos, Solitons and Fractals: the interdisciplinary journal of Nonlinear Science, and Nonequilibrium and Complex Phenomena, pp. 194-201

5. Trenchard, H. American Coot Collective On-water Dynamics. Nonlinear Dynamics, Psychology, and Life Sciences, Vol. 17, No. 2, pp. 183-203.

Thursday, November 14, 2013

Video demonstration of Peloton 5.5

In the video link below I discuss and demonstrate my Peloton 5.5 model, using Netlogo.  The model includes a few refinements over the version I presented in my recently published paper [1]. In that paper I apply my “peloton convergence ratio" (PCR) equation and examine peloton phase changes as a function of fractions of PCR. In that paper I also incorporate a “passing principle” whereby I suggest that when there is a significant power output differential between front and drafting riders, it is inevitable that drafting riders with greater relative energy stores will pass those ahead, but this passing capacity falls as riders approach maximal sustainable outputs.
          In Peloton 5.5 I break down PCR into its constituent elements: a fixed power output for a front non-drafting rider, a variable drafting rate -- which returns a correspondingly reduced power output for drafting riders relative to a riders in front positions -- and a variable MSO (“maximal sustainable output”).  I set an arbitrary output for the front rider, and allow the other variables to be adjusted returning a PCR that describes the output relationships between the front and the following riders.  
        With this I demonstrate two extreme peloton phases: the low-density stretched phase in which PCR approaches 1 in which little or no passing occurs, indicating that the power output of the following rider approaches her maximal sustainable output; a high density, high passing phase in which PCR is closer to zero. I then go on to show  mid-range of PCR in which we see oscillations between phase states as well as simultaneous occurrences of them. 
http://www.youtube.com/watch?v=-gmy520EEW4&feature=youtu.be

In a subsequent post I hope to discuss a recent peloton model created by Erick Ratamero (University of Warwick), which he presented at a conference in September.  He, myself, and Ash Richardson (University of Victoria), are in the stages of preparing a collaborative paper in which we look at the data I've obtained from two track races at the recent B.C. track championships.


Trenchard, H. 2013 Peloton Phase Oscillations. Chaos, Solitons and Fractals: the interdisciplinary journal of Nonlinear Science, and Nonequilibrium and Complex Phenomena, pp. 194-201

Monday, September 9, 2013

Geology in Motion: Tour de France and the dynamics of bicycle pelotons

Here is a link to a blog post by Susan Kieffer, in which she summarizes an earlier paper of mine:

Geology in Motion: Tour de France and the dynamics of bicycle pelotons

Her blog is also great and very interesting, I might add.

Sunday, September 8, 2013

Finally, a published paper; recent tweaks to my model, and current plan for next paper.

At last I have a paper published in an academic journal. The online version can be found in the link below, while the hard copy version is out in November, it appears. It is included in a special issue "Collective Behavior and Evolutionary Games", edited by Matjaz Perc and Paolo Grigolini.

    http://www.sciencedirect.com/science/article/pii/S0960077913001574


Full citation: Chaos, Solitons and Fractals: the interdisciplinary journal of Nonlinear Science, and Nonequilibrium and Complex Phenomena (2013), pp. 194-201 DOI information: 10.1016/j.chaos.2013.08.00


       In the paper I refer to my Netlogo model, which simulates the peloton as it oscillates between two primary phases: a low power output phase, and a high power output phase. I show how the peloton changes its pattern formations as a result of these collective power output changes.  
       After submitting that paper, I made a few tweaks to my model. The changes were small but resulted in increased realism. Also, instead of simply using what I call the "peloton convergence ratio (PCR)" as the main tunable parameter, I use other parameters which are incorporated into an actual equation that produces the PCR. Also, I included a new graph to show positional changes, which is an important indicator of the phase boundaries. Here a "phase" is simply a distinctive collective pattern formation. As cyclists know, peloton pattern formations are constantly changing, and hence "phase changes" and "transitions" between phases.

       To illustrate, look at image A, below. I've set the drafting range and maximal sustainable output ("MSO") parameters (two blue sliders immediately below the black "road") such that when they combine (i.e operate according to an equation) they produce a certain Peloton Convergence Ratio, or PCR, (second graph from the left). In this case the PCR is comparatively low. 

       Note that the graph on the left shows the power output of a front rider (black line), while the green line shows the power output of the drafting rider. 

       At this comparatively low PCR, the positional change is high, meaning the riders rotate positions frequently. This is realistic because the drafting rate is high and drafting riders are well "rested" for passing those in front. This would characterize a high density phase, low PCR phase.


A.


       However, in image B, below, I lowered the drafting rate. This has the effect of bringing the power output of the following rider closer to that of the front rider, and hence PCR increases toward 1 (see the steps on the green line for the power output of the drafting rider, and the corresponding step up in PCR). Notice how the peloton begins to stretch (also see the red line on the graph "Peloton Length"), and see the corresponding drop in positional change. The decrease in positional change means it is getting more difficult to pass.

B.


       In image C below, I dropped the drafting rate a bit more. As noted, this brings the power output of the drafting rider closer to the output of the front rider, and increases PCR. Notice how the positional change dropped at one point dramatically, and then began to fluctuate. Here, because the world "wraps" around in a cylinder, as the peloton stretches, riders get "lapped" fairly quickly. This is largely why we see the significant jumps in the positional change values, although in the appropriate PCR range we also see self-organized oscillations, where stretching and low positional change occurs for certain periods, followed by increased density and higher positional change, and so the cycle continues for unpredictable durations.

C


       So, this summarizes the result of my paper, although these recent tweaks connect the simulation even more clearly to the actual physical parameters we see in pelotons: drafting rate, power output of drafting rider relative to front rider, and riders' maximal sustainable outputs. These recent tweaks confirm the results of the published paper.

       My plan at this point is to gather some data from video footage I took of some mass-start events at the Provincial Track championships, and to demonstrate how rates of positional change show phase boundaries.
       Of course I would also like to show how these principles apply to other natural biological systems. The logical next place for me to look for this is American coot formations, since I have already seen and documented similar formations. The underlying mechanism for coot formations remains a hypothesis only, but this simulation itself should have, I think, applications in many different systems.

Monday, July 8, 2013

Tuesday, July 2, 2013

What is a peloton? Article in the Metchosin Muse


The following article of mine was published in the July/August issue of the Metchosin Muse (excuse the overlap). A more readable copy of the text follows (with a few minor edits from the printed version), following the article copy.


What is a peloton?
By Hugh Trenchard
Metchosin Muse  Vol. 21 Issue 7/8 (July/August 2013) p.13
photo and caption by Brian Domney
________________________

If you did not know what it was, from a distance and the right vantage point, it may appear as a gigantic amoeba that covers the width of the road, or like a snake that stretches 300 metres long.  Perhaps it is some unknown creature: it proceeds as an amorphous mass that shifts across the road, expanding and collapsing like an accordion. As it nears, whirring sounds and grunts are carried on the wind. Soon helmets may be discerned with the sun glinting off wheels and frames; then you may see spandex and turning legs, brown and muscled like horses.  This is not an alien creature at all, but a peloton, or a group of cyclists in a bicycle race. 
Every cyclist in the peloton races with some tactical or strategic objective in mind. However, at a more primitive level, each must be vigilant to avoid crashing into their neighbors, while keeping up speed with the group and adjusting their positions for the sweet spot where pedalling is easiest. If a cyclist shifts too far toward the back, she will know that the race is lost if she remains there until the finish, and so must constantly fight to stay near the front.
At this basic level, cyclists’ actions are determined by their responses to nearest neighbors, and by principles of physics, physiology and simple objectives.  Viewed this way, a peloton is very much akin to a flock of birds, or school of fish, or an ant colony. And for scientists who study them, animal collectives and biological and human systems like these are interesting because complex patterns emerge from simple underlying rules of behavior. 
In biological systems like these there are no leaders to command the positions of others within the group or how to go about their activities.  When patterns form without leaders, these patterns are said to self-organize, or to be "bottom-up" processes. In starling flocks we see amazing displays of self-organized shape and structure. On the West Coast we are all familiar with the precise, self-organized v-formations of geese. So too do we see similar structures and patterns in fish schools. In ant colonies, individual ants are not very smart, but sophisticated self-organized social behavior emerges when they interact according to a small set of basic rules. 
                A bicycle peloton is especially interesting because self-organized patterns emerge from basic human or physiological principles, while at the same time there are also leaders who may control the pace or command team-mates to alter their positions in the peloton. These leader-driven factors of bicycle racing are "top-down" in nature.
Self-organized peloton pattern formation is driven by three primary rules: avoid colliding with your neighbors, save energy by drafting (riding behind others), and advance toward the front.  We can see the first two of these are clearly universal principles, since we know how birds must avoid collision to stay aloft, and how their v-formations allow them to save energy and enhance their long-flight capabilities.
Some may argue that the third principle, the "front-position imperative" is not a universal biological principle, but is really the result of the competitive nature of a human-designed bicycle race and the objective of winning the race. However, we do actually see this kind of competitive drive in nature. For example, sperm engage in a similar competition for the front of the group and, as is commonly known, only one sperm will impregnate an egg.  Or, for a herd where food and water are scarce, the individuals who arrive at them first will survive, necessitating a competition for those resources. We can also imagine herds being chased by predators, where those individuals within the herd which advance to positions farthest from the predator are more likely to survive. 
                When we look at flocks, schools, or herds, it is not hard to see how they undergo changes in pattern formation. Some of these are changes in density, or how closely animals pack together. Some may be changes in alignment and direction, or speed. Changes in formation may be said to undergo phase changes, like those when water freezes to ice, or when water boils to steam.  It may seem obvious that this is what animals do, but the answers are not as obvious when you begin to explore why animals move collectively in the ways they do.
                Pelotons are accessible for studying all manner of collective behavior because we can obtain data about human physiological requirements, observe and track individuals who comprise the formations we see and correlate positional data with physiological data. Of course we can also learn from the riders themselves about their experiences. By contrast, it is not so easy to ask a goose how hard it was to keep up with the flock that brutish day in the howling headwind. But by learning about what cyclists do, so may we understand more about what starlings do, or what fish do, or what ants or huddling penguins do.
But the riches of peloton dynamics do not end there. There are other avenues of exploration as well. These studies fall within the domain of complex systems theory. Originally a branch of physics, it has grown in recent decades to be multi-disciplinary in scope, encompassing such disparate fields such as sociology, evolutionary biology, economics, ecology, and vehicle traffic flow.  By studying the amorphous oscillations of the peloton, we stand to gain insight into all of these areas.


Tuesday, May 7, 2013

Simulating Peloton Dynamics


In my introductory post I referred to complexity theory, which can broadly be described as the study of interactions.  Complexity theorists recognize there is great value in simulating the interactions of complex systems. This is largely because any large number of interacting elements presents difficult problems in determining the interactive principles that drive collective behavior.  In these kinds of systems there are often many factors that affect collective dynamics, and it is very difficult to control and isolate these factors for empirical experimentation [1].
        To the rescue, however, are computer simulations. A computer simulation is a powerful tool for tweaking the parameters by which it becomes possible to understand the interactive principles underlying collective dynamics. I have learned this first-hand in developing computer models of peloton dynamics. 
       Computer simulations fall in the domain of “computational models”.  Computational models contain computer algorithms (computer programs), carried out by the massive data processing capacities of computers [2].  I think of them as a kind of hybrid between a purely mathematical model in the form of math equations, and empirically observed behavior.  
       Computer simulations are a means of creating data that cannot be easily sourced in the real world.  Sometimes simulation data, or the behavior of the simulation, does not reflect real world processes very well. But in that case you can continue to add or omit algorithm parameters, or tweak existing ones. By this process, you can make predictions about real world behavior. If your simulation reasonably matches the real world behavior you are modelling, then you have learned something fundamental about the principles that drive real world behavior. In this way the process of computer simulation can be a rich source of discovery and satisfaction.
       Although I have no special mathematical training, by creating peloton computer simulations, I’ve derived a few mathematical equations for processes that I may not have done without the “heuristic” tool, or trial and error process, that computer programming allows. Incidentally, this has also led me to understand better how mathematical equations are derived in the first place: by gathering data and finding patterns and relationships in that data.  
      That said, the equations I’ve developed may not be the best ones for the peloton behavior I’m trying to model. Improvements on a number of levels may still be made. However, one wonderful thing about computer simulations is that once your simulation shows behavior that reasonably reflects real world behavior, the simulation itself validates your algorithm. Even if you have trouble articulating what you have developed, a working simulation transforms your intuitions and speculation to the realm of solid evidence, reproducible results and testable predictions.
       So, on that note, here are some things I’ve worked up.

The relationship between speed, power output, and drafting benefit


        I've started by looking at the relationship between cyclists' power output, their speed, and the power output reductions (energy savings) caused by drafting. Without getting into too much detail here, this leads to a basic relationship between these elements, one that I refer to as the "peloton-convergence-ratio" (PCR). I have a couple of equations for this, but this one is the better of the two [3]:


         Where PCR is the Peloton Convergence Ratio;
        Pqfront is the power output of the front rider at the given speed and equals the power output required by the following, drafting rider, to maintain the speed set by the front rider if the following rider were not drafting (hence “required output”);
       Pmaxdraft is the maximum sustainable output of the following rider.

       The equation expresses what all cyclists know:  a drafting rider can match the speed of a front rider even at speeds that would exceed the drafting rider's capacity if the front rider were not there to create the drafting zone for the following rider. When PCR exceeds the value 1, that is the point at which a front rider and a following rider separate, or "de-couple". One nice thing about this equation is that it incorporates speed, which determines drafting magnitude, while also differentiating between speed and power output. Power output, of course, is independent of speed, and PCR accounts for this fact, and encompasses hill-climbing situations in which riders decouple at lower speeds. This is shown in the graph below. The horizontal line at PCR 1.0 shows the de-coupling point between cyclists as their speeds increase, shown on different incline gradients. 


Figure 1.


       PCR, as a ratio, is fundamental to my computer simulation. My approach has been to create an algorithm that includes PCR as a manually adjustable parameter; i.e. a ratio between 0 and 1 (or a bit over 1). Adjusting PCR up means that coupled cyclists' capacity to pass each other falls; conversely, at lower PCR, cyclists can pass each other freely. This is a simple point to make, but it is very important in modeling peloton behavior. With this basic information, we have the foundation for an algorithm that generates realistic peloton behavior. 

The passing principle

       Here is where it gets dicey. If we start with the premise that passing gets more difficult as cyclists' collective power output increases, then we can simply use our adjustable PCR "knob" to adjust the power output value up or down, and at low PCR, or power output levels, cyclists pass more freely and easily; at higher PCR, or power outputs, passing takes longer and happens less frequently in the peloton as a whole.  This suggests there is some some constant, low-value, baseline measure of distance, time, or the number of cyclists that one cyclist can realistically travel, or pass, while passing others in one go. Presently, I don't have a realistic representation of this constant.
       The absence of such a constant is not the end of the world though, since my simulation is designed not necessarily to be highly accurate, but to demonstrate that certain principles, like the passing principle, are real; that these principles can be modeled and result in some realistic behaviors.
       So we can begin with some rough eye-ball base level passing parameter, which we then can adjust by changing PCR as a fraction of 1, and develop a working equation for the passing dynamics. At this point, since a paper of mine containing more details is under review by an academic journal, it is prudent that I not state my equation straight out. In addition, since submitting that paper I've modified the equation so that it now describes cyclists' passing times in a modified T = D/V (time =  distance / velocity) form. This recent modification may be something the reviewers will ask me for in any event [4]. I will add, however, that my model also incorporates and modifies elements of Uri Wilenski's Netlogo flocking model [5], which I have found are necessary components for a realistic peloton model.  
       Nevertheless, I feel comfortable showing a few basic results.
       For example, the 3D graph below (Figure 2) shows all the cyclists' passing times for my equation in modified T=D/V form, after plugging in a passing constant and PCR values into my equation over a range of incline gradients (hills). Looking at the vertical y-values ("passing time (seconds)"), we see that time required to pass increases as peloton speeds increase (z-axis), and at lower speeds as you climb hills (x-axis). It is more or less a 3D version of Figure 1, except that Figure 2 indicates passing times, and contains values that are applied in my Netlogo peloton simulation. 

                            
Figure 2.


       So, essentially my Netlogo model computes all the values shown in Figure 2 and computes them for any number of simulated cyclists in a peloton. Combined with the modified Wilenski flocking rules, as I noted above, we see the emergence of chaotic (apparently) oscillations in peloton length (distance from front rider to rear rider, shown by the red line), particularly at mid-range PCR levels, as shown in Figures 3 and 4.


Figure 3. 


Figure 4. 


       If we look at the simulated cyclists themselves, the peloton length oscillations (red line) shown in the graphs above, occur in sequences that are rather like the examples shown in the shots below. 


Above, the peloton is together in a single goup.


Above, the peloton has split, and the two groups are heading generally in different directions.


Above, the lower group is more stretched than the one above.


Above, the peloton has split into three groups. In this sequence, the split at the left of the view was temporary, as the group quickly reintegrated. 

        So, there are some basic elements of my peloton model. In its basic form it is not much different from a couple of my previous versions, but this one is perhaps the best in terms of its having incorporated an equation that may be translated into actual measurable values; i.e. the times required for cyclists to pass others as they increase their collective power output. In this way, this model and its algorithm may be checked against actual data acquired from pelotons. Despite the abundance of riders using power-output meters and other handy technologies, my own experience is that it is not easy to gather this data for a whole peloton, particularly on a small budget. Still there are a few relatively inexpensive ways to gather data that can go a long way to increasing our understanding of self-organized peloton dynamics. More for another post. 


Notes and references

[1]  See for example, Phillip Ball’s description, in “Why Society is a Complex Matter” 2012 Springer Verlag, Berlin, at p. Xii “Not only do outcomes often depend on a host of different contingencies, but sometimes there may be too much variability in the system – too sensitive a dependence on random factors – for outcomes to be repeatable. “
[2] http://en.wikipedia.org/wiki/Computational_model
[3] Note: this equation is contained in a paper of mine under review for possible publication; however, before submitting it I had earlier mentioned it relation to a Netlogo model I had uploaded to the Netlogo Community Models website, so it was already in the public domain. 
[4] Acknowledgement to Ashlin Richardson for encouraging me to modify my equations/model to be in this form, or similar form.
[5] Wilensky, U. (1998). NetLogo Flocking model.http://ccl.northwestern.edu/netlogo/models/Flocking. Center for Connected Learning and Computer-Based Modeling, Northwestern Institute on Complex Systems, Northwestern University, Evanston, IL.

Tuesday, April 2, 2013

Introduction:

           Energy savings by following others occurs throughout nature. For example, it is well-established that birds save energy by flying in vee formations [1], fish save energy in a school [2], young dolphins save energy by swimming next to their mothers [3], penguins save energy by huddling [4], ducklings save energy by paddling behind their mother [5].
         In bicycle pelotons, or groups of cyclists, following behind other cyclists is called drafting. Drafting allows a following rider to save considerable energy relative to a non-drafting cyclist who is riding "in the wind". While cyclists are keenly aware of the benefits of drafting, perhaps not all are aware how drafting, when combined with other factors, causes pattern formation in pelotons.
          Below is photo from a race in Victoria, B.C. It shows a criterium, a race on a loop around a few city blocks. Courses are usually about 1 km to make a lap, and cyclists must complete many laps of the course.   For the footage of that race, I rented a 45 foot boom lift and set it on one of the course corners.

A peloton. Men's Cat 1,2 Bastion Square Criterium, 2012.
      Of course there is nothing new about the concept of energy savings. By their very definitions, notions of efficiency or optimization involve the least use of energy and resources to produce maximum payoff for any given activity. These concepts confront us every day in many ways and contexts. Indeed, we can imagine that most sorts of cooperative behavior is likely to involve mutual energy savings.  However, while notions of efficiency, optimization, and cooperation are commonplace in our lexicon and well studied generally, I have found that there is little research and understanding of how energy savings within systems results in pattern formation; what those patterns are, whether they are visually obvious patterns, or mathematical ones that are hidden in the structure of the system and its behavior.
      I am largely concerned with how following others in some way or another reduces energy expenditure not only for the follower, but also where coupling of some kind occurs that results in mutual energy savings. So, while my frame of reference and the focus of my research is the bicycle peloton and its dynamics, I hope to explore where in nature similar principles of energy savings and their patterns arise. I hope to show that pattern formations in pelotons are driven by universal principles that apply to many other human, biological and non-biological systems. I will seek evidence for the presence of these universal principles in other systems, and hope to show either by my own original research or by reference to the research of others, where these principles occur, and their implications. For me this process is becoming a kind of lifelong quest; a search for universal principles and their manifestations in nature.

What, a bunch of birds on the water? A peloton?
American coots on Elk Lake near Victoria, B.C.


What the devil? A skunk cabbage spadix? Surely Hugh's out to lunch now!
       
What, praytell, is this?
What does this have to do with anything?
That's it, Hugh's really gone off his rocker. 
                                         
The quest that I embark upon takes me deeply into the field of study known as complexity theory. Complexity theory has its origins as a branch of physics [6], but it is now viewed more broadly as encompassing the study of the dynamics of any collection of interacting components. 
      In his book [7],"Why Society is a Complex Matter" (2012), Phillip Ball says:

Definitions vary, but there is a general consensus that a complex system is one  made up of many components (which might or might not be identical) that interact strongly with one another. When these components are autonomous entities that can make decisions - representing animals, people, institutions and so forth - they are often called agents.

The Peloton 
     
      As noted, cyclists save energy by drafting. Energy expenditure is reduced by approximately 18% at 32 km/hr (20 mph), 27% at 40 km/hr (25 mph), when drafting a single rider [8]. If among a group of eight riders, energy savings is as much as 39% at 40 km/hr; energy saved by drafting is negligible at speeds lower than 16 km/hr [8]. From these figures we can see that a reasonable approximation of the energy savings due to drafting for a cyclist drafting one other is 1 % per mile an hour, at speeds greater than 10 mph (16 km/h), as I show in the figure below.


Power requirements for cyclist in non-drafting position and cyclist in drafting position. Curve for non-drafting cyclist based on 75kg (bicycle and rider); rolling friction coefficient 0.004 dimensionless;  0.00 gradient; air-density 1.226kg/m3; drag co-efficient of 0.5; frontal surface area of 0.05m2 (parameters from www.analyticcycling.com). Curve for drafting cyclist based on approximate 1% savings per mile/hr (Hagberg and McCole 1990; Burke, 1996; Figure adapted from [9]).

     
      When riders draft, or alternate between non-drafting and drafting positions, they may be said to be coupled. Coupling means that they mutually interact; that the actions of one influences the actions or the properties of another, and vice-versa. When coupling occurs between a cyclist and her immediate surrounding neighbours, they may be said to be "locally" coupled or interacting. When a larger group of cyclists displays patterns of behavior due to the effects of local coupling, the whole group may be said to be globally coupled. In the parlance of complexity science, when global behaviors occur due to principles of local coupling, the global behavior is said to "emerge". Global behaviors are "emergent" or show "emergent behavior" or "emergent patterns".
      There are many emergent patterns in pelotons. They occur within certain ranges of cyclists' power output and speed. Power output and speed are independent of each other in cycling, because a cyclist might at one time be going uphill very slowly while exerting maximum power. Or he might be going very fast downhill, and exerting very little power. So, it is more accurate to think of emergent patterns as occurring within certain power-output ranges. However, as the cycling uphill example demonstrates, drafting benefit is a function of both power output and speed. This is because a cyclist might be riding at maximum up a very steep hill and deriving no drafting benefit at all. It is not until the course levels out and the cyclists can travel at higher speeds that a following rider may head for the slipstream of her compatriot for relief. As a result, in my discussions I will refer sometimes to power separately from speed, and sometimes to both speed and power as necessarily connected.
      So there's an introduction. In the course of these posts, I will often delve into speculative analysis that does not currently have much research in support, but I hope to support it with as much sound reasoning and evidence as I can. Occasionally, I may post something that is not necessarily in sequence or in context of another post that immediately precedes, but I will attempt to tie the relevance of the post to the general aims of this blog.
...

Next: peloton "phases". 
    
Notes and references

1. Weimerskirch H., Julien M., Clerquin Y., Alexandre P., Jiraskova S. 2001. Energy Saving in Flight Formation, Nature, 413, 697-698; Cutts C., Speakman J. Energy Savings in Formation Flight of Pink-footed Geese, 1994, J. Exp. Biol. 189, 251–261, citing Lissaman and Shollenberger, 1970; Badgerow and Hainsworth 1981.

2. Herskin J., Steffensen F. 1998. Energy Savings in Sea Bass Swimming in a School: Measurements of Tail Beat Frequency and Oxygen Consumption at Different Swimming Speeds, Journal of Fish Biology, Vol 53, Issue 2, 366–376.

3. Weihs, D. 2004. The Hydrodynamics of Dolphin Drafting, Journal of Biology, 38(8), 1-23.

4. Gilbert C., Blanc S., Le Maho Y., Ancel A. 2008. Energy Savings Processes in Huddling Emperor Penguins: From Experiments to Theory, Journal of Experimental Biology 211, 1-8.

5. Fish, F. 1995. Kinematics of Ducklings Swimming in Formation: Consequences of Position, The Journal of Experimental Zoology 273:1-11.

6. For example: Waldrop, M. 1992. Complexity - The Emerging Science at the Edge of Order and Chaos. A Touchstone Book. New York. "This is a book about the science of complexity - a subject that is still so new and wide-ranging that nobody knows quite how to define it..."

7. Ball, P. with a contribution by Dirk Helbing. 2012. Why Society is a Complex Matter. Springer-Verlag, Berlin Heidelberg.


8.  McCole S.D, Claney K., Conte J.C., Anderson, R., Hagberg J.M. 1990. Energy expenditure during bicycling. Journal of Applied Physiology. 68:748-753.

9.Trenchard, H. 2010. Hysteresis in competitive bicycle pelotons. Complex Adaptive Systems – Resilience, Robustness and Evolvibility: Papers from AAAI Fall Symposium FS-10-03 130-137