The subject of this post is quite different from that of the last one, where I referred to spheres dropping in a viscous fluid, and proposed an experiment to study convection properties of spheres in such a viscous fluid. I suggested such a study could give some insight into the self-organizing convection dynamics of pelotons.
In this post, I discuss how a peloton IS a fluid, not how it moves through a viscous fluid as in my last post, but how it is a viscous fluid and, viewed in this way, what some of its properties are. Here I propose a model for quantifying laminar and turbulent flow in pelotons.
In fluid dynamics, the Reynolds number is a dimensionless value by which a phase change from laminar (streamlined) flow to turbulent flow may be identified [1]. A very nice explanation of the Reynolds number can be found here: http://www.youtube.com/watch?v=kmjFdBxbV08
To develop an equivalent to a Reynolds number for pelotons, we first must show viscosity in pelotons.
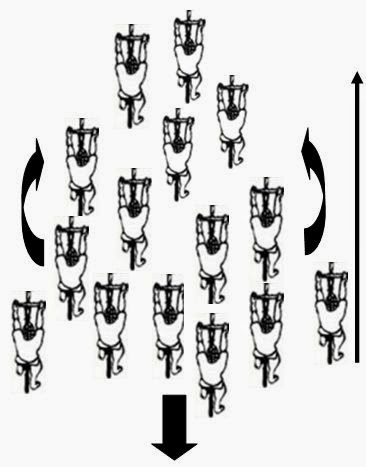
Below is an illustration I've photocopied from [a] and on which I have overlaid some parameter descriptions (in red italics) as to how they might apply to pelotons.

Figure 1. Copy of Figure 15.23 at page 439 of [a], with notations of mine in red italics.
Below is a screen-shot of the Netlogo interface, and the parameters I've used to develop my model.

Figure 2. Screen capture of my Netlogo peloton fluid dynamics model, publicly available at
In summary:
n (viscosity) = Fl / Av
- F is pedal force at given speed -- equivalent to external force moving top surface of liquid
- l is mean lateral distance between cyclists -- equivalent to distance between solid surfaces
- A is area of one side of peloton, or line of riders -- equivalent to area of upper plate
- v is relative passing speed -- equivalent to the distance displacement (delta x) / second, determined by cyclists' actual passing speed - mean peloton speed
Reynolds number = pdv / n
where:
Introduction
Riders in a peloton, or group of cyclists, are coupled by the energy savings benefit of drafting. By drafting, riders in zones of reduced air-pressure behind others expend less energy than those who are facing the wind. By coupling, cyclists share and distribute energetic resources among the group as a whole. In this sense, drafting may be thought of as an attractive or cohesive force among riders.
In mass-start bicycle racing, pelotons may consist of up to 200 riders. In such groups, cyclists attain high density in continuously deforming peloton shapes. Density changes are generated by cyclists’ collective power output. At very low power output, riders tend to leave a lot of space between each other, and so density is comparatively low. As outputs and speeds increase, riders tuck in as closely as possible to others to obtain maximum drafting benefit, increasing density. At intermediate outputs/speeds, the peloton shape is roughly square or round and density is high. As cyclists’ outputs approach anaerobic threshold, the peloton begins to stretch into a line.
Although a peloton displays properties similar to liquid flow generally, a peloton is unlike a fluid flowing through a tube which constrains the shape of the fluid. The diameter of a tube may vary along the length of the tube, and this changes the “shape” of the fluid inside the tube, but the tube is an external constraint on the shape of the fluid inside the tube. Liquid by itself doesn’t generally flow in shapes of varying diameters, and on an open flat surface, the liquid will simply spread out to its minimum thickness.
By contrast, the shape of a peloton is continuously changing as a result of oscillations in the collective power of the riders. True, the course over which a peloton travels can vary in width and, if sufficiently narrow, the course does constrain the shape of the peloton. However, we can imagine a road of infinite width, and the peloton would still self-organize into its ordinary expected shapes, changing continuously and independently of the course width. As a result, if we want to find equivalencies between peloton flow and fluid flow, we need to account for this changing shape.
Constant and variable density
Another difference between peloton flow and liquid flow is that a peloton exhibits significant changes in density, unlike liquid fluids which are mostly incompressible [1].
In [2] a method used to calculate density showed that density falls as the peloton stretches. However, another conception of peloton density is that as long as the wheel spacing between cyclists is roughly constant, changing peloton shape by stretching does not mean density decreases. In other words, the peloton could be either stretched in a single-file line, or in a compact round shape, but the mass of cyclists per volume is still the same.
In the peloton fluid dynamical model proposed here, density can be set as a constant parameter despite continuous peloton deformation. To be sure, in conditions of low drafting such as up steep hills, or during full-out sprints, spacing between riders increases and peloton density falls. However, although low density is observed in periods of very low and very high output, a peloton retains high-density over a broad range of intermediate outputs, and density may be considered to be constant over this range.
Constant density is useful for this peloton fluid model. As a result we can maintain constant density, then apply an adjustment factor to the length and width of the peloton according to cyclists’ coupled outputs as a fraction of their mean maximum output. Both the length and width measurements have considerable effect on viscosity value and the Reynolds number, and so adjusting them appropriately is a key consideration.
Although conceptually the model applies a constant density parameter in a broad intermediate range of peloton speeds (the range in which the majority of peloton behavior occurs), it does allow for changing density. By adjusting the density slider between 9kg m^3, approximately the minimum density at which cyclists remain coupled by drafting (i.e. if cyclists are 1m behind and to the sides of others, or more, drafting benefit drops off dramatically – here this corresponds to about 18 cyclists in a 100m^2 area).
Application of Peloton-Convergence-Ratio (PCR)
In [2,3] we demonstrated the “Peloton-convergence-ratio” (PCR), which corresponds directly with the changing shape of the peloton. PCR is an equation that accounts for cyclists’ reduced power requirements in drafting positions, while also indicating cyclists output at any given moment as a fraction of their maximum sustainable output (MSO).
As PCR increases (i.e. as cyclists approach MSO), the peloton stretches, and conversely as PCR falls, the peloton resumes its compact formation. In this peloton fluid model, I apply PCR to adjust the shape of the peloton in direct proportion to the length which increases as PCR increases; inversely to width, which decreases as PCR increases (i.e. as the peloton stretches). When PCR = 1 for a peloton collectively, that means the all following (drafting) riders are at their maximum even with the benefit of drafting. This represents the extreme outputs for riders in a maximally stretched formation. Before reaching this point, however, we can think of riders adjusting their relative positions in a highly turbulent manner, and that as speeds are adjusted incrementally higher, each corresponding adjustment in position must happen faster than the previous adjustment, and hence the Reynolds number is higher. When PCR > 1, riders de-couple. Although there is a temporary decrease in density while cyclists remain in drafting zones, the globally coupled systems breaks down.
Applying PCR to account for cyclists’ power output relative to their maximums is important for a peloton model because these factors affect the force and velocity parameters of the fluid viscosity and Reynolds number equations, and scales them appropriately to typical peloton speeds and power output values. See Notes 3-5.
MSO can be adjusted, which can be thought of as changing “how easy it is” for the cyclist to travel at the given speed. A higher MSO, means the given pace will be easier for him/her, and conversely for a lower MSO.
Temperature-viscosity relationship
As temperature increases, viscosity falls, as the speed of interactions between molecules reduces friction between them [4]. Increasing the relative-passing speed is effectively like changing the temperature of the peloton, resulting in decreasing viscosity, as expected [1].
However, here I don’t address whether the equations for the relationship between temperature and viscosity [6] accord with the equations I’ve developed that adjust the shape of the peloton according to increasing speed, and hence the peloton viscosity and Reynolds number.
I used the following as constants: 100 cyclists 75kg each in a 10m * 10m grid * 1.5m (height of crouching cyclist on bike) yielding constant high density of 50kg m^3 (75kg * 100 / 150m^3) ; base peloton width of 10m -- equating to tube diameter; minimum peloton “side-area” of 12.4m^2, based on 5 cyclists on bikes 1.65m (tip of front-wheel to outside tip of rear-wheel) * 1.5m (height of cyclist’s head/shoulder in crouched position on bike) -- equating to parameter A in the viscosity equation (area of the fluid boundary layer).
Starting with these values, we can make adjustments to mean-peloton speed and passing speed to generate relative-passing speed. Generally, unless they are “attacking” to escape the peloton, cyclists do not pass each other much faster than between approximately 5km/h (1.39 m/s) and 10km/h (2.78 m/s) in normal peloton movement. Regardless, inputting any values you can see how viscosity and Reynolds number change in correlation to relative passing speed. Speeds in turn affect the drafting rate, and PCR, which affect the shape of the peloton (length and width).
You can adjust the MSO values for a drafting rider. As noted above, this affects PCR, and the comparative “ease” of pace for the drafting cyclist. It does not account for the front cyclist’s output, since most of the riders in the peloton are assumed to be drafting.
Overall the results seem to accord reasonably well with what the physics literature says is the Reynolds number range at which to expect turbulence; i.e. above 3000, with an unstable region between 2000-3000 [1]. It also accords roughly with what we can expect in terms of phase transitions according to PCR, where the peloton is stretched at higher PCR. In terms of viscosity, the value is shown in N*m/s^2 (where 0.001 Nm/s^2 = .001 centipoise), and in the turbulent region, peloton viscosity is roughly equivalent to high viscosity fluids, like syrup or molasses [5].
However, the results indicate that the unstable region (Reynolds number 2000-3000) does not occur until the passing speed is about 3.65m/s, or slightly more than 13km/h. Intuitively, it seems that turbulence occurs at lower passing speeds than this. This suggests some of my initial assumptions are inaccurate, or some adjustments need to be made in the model overall -- or, indeed, that true turbulence as it would occur in analogous systems, does not emerge until passing speeds are > than 13km/h. I am inclined toward the two former options, however, and would want to check things quite a lot before I conclude the last option.
However, because the values are not extraordinarily outside the expected range, the model is promising in terms of demonstrating viscosity and the transitional regimes of laminar and turbulent flow.
In addition, there is no attempt here to draw parallels to substantially more complex Navier-Stokes equations of fluid dynamics [6].
As discussed, there is a relationship between temperature and viscosity and Reynolds number. By increasing the passing speed relative to the mean-peloton-speed (i.e. increase in relative-passing-speed), the process is similar to increasing the temperature of the fluid. This results in decreasing viscosity, which accords with what is expected [4]. However, here I don’t address whether the equations I’ve developed to adjust the shape of the peloton according to increasing speed, and hence the peloton viscosity and Reynolds number, align with established equations for the relationship between temperature and viscosity [4].
Also, the application of PCR, used to adjust the shape of the peloton, may in principle be flawed. Nonetheless, this is an attempt to account for the changing shape of the peloton, in contrast to other fluids that conform to the shape of their containers.
While the proposed model is idealized, the key is that a peloton exhibits relative changes in position and speed among globally coupled cyclists, which, it seems, are amenable to a fluid dynamics analysis. The proposed model identifies some of the key parameters which are parallel to the standard fluid viscosity and Reynolds number, and indicates, at least, that it is possible to model a peloton as a fluid.
Overall, I well expect there are flaws in the model. These flaws may be conceptual and/or smaller ones that can be fixed without destroying the the basic principles.
where:
[1] Serway,Raymond and Jerry Faughn. 1989 2nd. ed. College Physics. Saunders College Publishing, Philadelphia
[2] Trenchard, H., Richardson, A., Ratamero, E., Perc, M. 2014. Collective behavior and the identification of phases in bicycle pelotons. Physica A 405 (2014) 92-103.
[3] Trenchard, H. 2013. Peloton phase oscillations. Chaos Solitons & Fractals. 56 (2013) 194–201(56):194-201.
[4] http://en.wikipedia.org/wiki/Temperature_dependence_of_liquid_viscosity
[5] http://www.research-equipment.com/viscosity%20chart.html
[6] http://catdir.loc.gov/catdir/samples/cam031/00053008.pdf
- p is peloton density -- equivalent to fluid density in kg m^3
- d is maximum width of the peloton -- equivalent to tube diameter in m
- v is mean peloton speed in m/s -- equivalent to mean fluid velocity along direction of flow
Introduction
Riders in a peloton, or group of cyclists, are coupled by the energy savings benefit of drafting. By drafting, riders in zones of reduced air-pressure behind others expend less energy than those who are facing the wind. By coupling, cyclists share and distribute energetic resources among the group as a whole. In this sense, drafting may be thought of as an attractive or cohesive force among riders.
In mass-start bicycle racing, pelotons may consist of up to 200 riders. In such groups, cyclists attain high density in continuously deforming peloton shapes. Density changes are generated by cyclists’ collective power output. At very low power output, riders tend to leave a lot of space between each other, and so density is comparatively low. As outputs and speeds increase, riders tuck in as closely as possible to others to obtain maximum drafting benefit, increasing density. At intermediate outputs/speeds, the peloton shape is roughly square or round and density is high. As cyclists’ outputs approach anaerobic threshold, the peloton begins to stretch into a line.
A fluid dynamics approach to peloton behavior
Certain basic properties of fluids, such as viscosity (internal fluid friction, or “thickness”), and its flow characteristics, like laminar flow (streamlined flow in which particle paths do not cross) or turbulent flow [1], appear to exhibit similarities to the “flow” properties of a peloton. In measuring liquid fluid properties (gasses are not considered here), liquid is conceptualized as flowing through a tube [1]. The fluid is considered to fill the tube, and its internal properties can be measured using parameters indicated by the dimensions of the tube (like tube diameter and volume). The Reynolds number is a dimensionless value that describes the transition between laminar and turbulent flows [1]. Generally laminar flow occurs at Reynolds numbers less than 2000; above 3000, turbulent flow is expected; between 2000 and 3000 the fluid flow is unstable, meaning flow may be laminar but easily perturbed into turbulence [1].Although a peloton displays properties similar to liquid flow generally, a peloton is unlike a fluid flowing through a tube which constrains the shape of the fluid. The diameter of a tube may vary along the length of the tube, and this changes the “shape” of the fluid inside the tube, but the tube is an external constraint on the shape of the fluid inside the tube. Liquid by itself doesn’t generally flow in shapes of varying diameters, and on an open flat surface, the liquid will simply spread out to its minimum thickness.
By contrast, the shape of a peloton is continuously changing as a result of oscillations in the collective power of the riders. True, the course over which a peloton travels can vary in width and, if sufficiently narrow, the course does constrain the shape of the peloton. However, we can imagine a road of infinite width, and the peloton would still self-organize into its ordinary expected shapes, changing continuously and independently of the course width. As a result, if we want to find equivalencies between peloton flow and fluid flow, we need to account for this changing shape.
Constant and variable density
Another difference between peloton flow and liquid flow is that a peloton exhibits significant changes in density, unlike liquid fluids which are mostly incompressible [1].
In [2] a method used to calculate density showed that density falls as the peloton stretches. However, another conception of peloton density is that as long as the wheel spacing between cyclists is roughly constant, changing peloton shape by stretching does not mean density decreases. In other words, the peloton could be either stretched in a single-file line, or in a compact round shape, but the mass of cyclists per volume is still the same.
In the peloton fluid dynamical model proposed here, density can be set as a constant parameter despite continuous peloton deformation. To be sure, in conditions of low drafting such as up steep hills, or during full-out sprints, spacing between riders increases and peloton density falls. However, although low density is observed in periods of very low and very high output, a peloton retains high-density over a broad range of intermediate outputs, and density may be considered to be constant over this range.
Constant density is useful for this peloton fluid model. As a result we can maintain constant density, then apply an adjustment factor to the length and width of the peloton according to cyclists’ coupled outputs as a fraction of their mean maximum output. Both the length and width measurements have considerable effect on viscosity value and the Reynolds number, and so adjusting them appropriately is a key consideration.
Although conceptually the model applies a constant density parameter in a broad intermediate range of peloton speeds (the range in which the majority of peloton behavior occurs), it does allow for changing density. By adjusting the density slider between 9kg m^3, approximately the minimum density at which cyclists remain coupled by drafting (i.e. if cyclists are 1m behind and to the sides of others, or more, drafting benefit drops off dramatically – here this corresponds to about 18 cyclists in a 100m^2 area).
Application of Peloton-Convergence-Ratio (PCR)
In [2,3] we demonstrated the “Peloton-convergence-ratio” (PCR), which corresponds directly with the changing shape of the peloton. PCR is an equation that accounts for cyclists’ reduced power requirements in drafting positions, while also indicating cyclists output at any given moment as a fraction of their maximum sustainable output (MSO).
As PCR increases (i.e. as cyclists approach MSO), the peloton stretches, and conversely as PCR falls, the peloton resumes its compact formation. In this peloton fluid model, I apply PCR to adjust the shape of the peloton in direct proportion to the length which increases as PCR increases; inversely to width, which decreases as PCR increases (i.e. as the peloton stretches). When PCR = 1 for a peloton collectively, that means the all following (drafting) riders are at their maximum even with the benefit of drafting. This represents the extreme outputs for riders in a maximally stretched formation. Before reaching this point, however, we can think of riders adjusting their relative positions in a highly turbulent manner, and that as speeds are adjusted incrementally higher, each corresponding adjustment in position must happen faster than the previous adjustment, and hence the Reynolds number is higher. When PCR > 1, riders de-couple. Although there is a temporary decrease in density while cyclists remain in drafting zones, the globally coupled systems breaks down.
Applying PCR to account for cyclists’ power output relative to their maximums is important for a peloton model because these factors affect the force and velocity parameters of the fluid viscosity and Reynolds number equations, and scales them appropriately to typical peloton speeds and power output values. See Notes 3-5.
MSO can be adjusted, which can be thought of as changing “how easy it is” for the cyclist to travel at the given speed. A higher MSO, means the given pace will be easier for him/her, and conversely for a lower MSO.
Temperature-viscosity relationship
As temperature increases, viscosity falls, as the speed of interactions between molecules reduces friction between them [4]. Increasing the relative-passing speed is effectively like changing the temperature of the peloton, resulting in decreasing viscosity, as expected [1].
However, here I don’t address whether the equations for the relationship between temperature and viscosity [6] accord with the equations I’ve developed that adjust the shape of the peloton according to increasing speed, and hence the peloton viscosity and Reynolds number.
Things to try
So, with these considerations in mind, in my Netlogo peloton fluid dynamics model we can plug some realistic values into the model and see the resulting viscosity and Reynolds number, and make predictions as to the values at which laminar flow transitions to turbulent flow. Generally, we may predict that at appropriate combinations of PCR, relative passing speed, and peloton shape, turbulence sets in.I used the following as constants: 100 cyclists 75kg each in a 10m * 10m grid * 1.5m (height of crouching cyclist on bike) yielding constant high density of 50kg m^3 (75kg * 100 / 150m^3) ; base peloton width of 10m -- equating to tube diameter; minimum peloton “side-area” of 12.4m^2, based on 5 cyclists on bikes 1.65m (tip of front-wheel to outside tip of rear-wheel) * 1.5m (height of cyclist’s head/shoulder in crouched position on bike) -- equating to parameter A in the viscosity equation (area of the fluid boundary layer).
Starting with these values, we can make adjustments to mean-peloton speed and passing speed to generate relative-passing speed. Generally, unless they are “attacking” to escape the peloton, cyclists do not pass each other much faster than between approximately 5km/h (1.39 m/s) and 10km/h (2.78 m/s) in normal peloton movement. Regardless, inputting any values you can see how viscosity and Reynolds number change in correlation to relative passing speed. Speeds in turn affect the drafting rate, and PCR, which affect the shape of the peloton (length and width).
You can adjust the MSO values for a drafting rider. As noted above, this affects PCR, and the comparative “ease” of pace for the drafting cyclist. It does not account for the front cyclist’s output, since most of the riders in the peloton are assumed to be drafting.
Results
As relative-passing speed is increased, viscosity falls and Reynolds number increases. When PCR > 1, viscosity is 0, and Reynolds number is negative.Overall the results seem to accord reasonably well with what the physics literature says is the Reynolds number range at which to expect turbulence; i.e. above 3000, with an unstable region between 2000-3000 [1]. It also accords roughly with what we can expect in terms of phase transitions according to PCR, where the peloton is stretched at higher PCR. In terms of viscosity, the value is shown in N*m/s^2 (where 0.001 Nm/s^2 = .001 centipoise), and in the turbulent region, peloton viscosity is roughly equivalent to high viscosity fluids, like syrup or molasses [5].
However, the results indicate that the unstable region (Reynolds number 2000-3000) does not occur until the passing speed is about 3.65m/s, or slightly more than 13km/h. Intuitively, it seems that turbulence occurs at lower passing speeds than this. This suggests some of my initial assumptions are inaccurate, or some adjustments need to be made in the model overall -- or, indeed, that true turbulence as it would occur in analogous systems, does not emerge until passing speeds are > than 13km/h. I am inclined toward the two former options, however, and would want to check things quite a lot before I conclude the last option.
However, because the values are not extraordinarily outside the expected range, the model is promising in terms of demonstrating viscosity and the transitional regimes of laminar and turbulent flow.
Conclusions and model limitations
The model represents the passing speed of one segment of the peloton – essentially one single-file line on one perimeter of the peloton. If the standard viscosity model applies, we should assume that the speeds of each line or layer (shear flow) diminishes to zero as they approach the opposite side of the peloton. This of course does not occur in pelotons. Further, aside from a simplified single point-in-time change in speed which is assumed to represent an average among all passing cyclists, the model does not indicate other differences in speeds among cyclists within the peloton. Nor does it indicate trajectory changes, which together with a range of speed differentials among riders, might indicate the presence of vortices and eddies.In addition, there is no attempt here to draw parallels to substantially more complex Navier-Stokes equations of fluid dynamics [6].
As discussed, there is a relationship between temperature and viscosity and Reynolds number. By increasing the passing speed relative to the mean-peloton-speed (i.e. increase in relative-passing-speed), the process is similar to increasing the temperature of the fluid. This results in decreasing viscosity, which accords with what is expected [4]. However, here I don’t address whether the equations I’ve developed to adjust the shape of the peloton according to increasing speed, and hence the peloton viscosity and Reynolds number, align with established equations for the relationship between temperature and viscosity [4].
Also, the application of PCR, used to adjust the shape of the peloton, may in principle be flawed. Nonetheless, this is an attempt to account for the changing shape of the peloton, in contrast to other fluids that conform to the shape of their containers.
While the proposed model is idealized, the key is that a peloton exhibits relative changes in position and speed among globally coupled cyclists, which, it seems, are amenable to a fluid dynamics analysis. The proposed model identifies some of the key parameters which are parallel to the standard fluid viscosity and Reynolds number, and indicates, at least, that it is possible to model a peloton as a fluid.
Overall, I well expect there are flaws in the model. These flaws may be conceptual and/or smaller ones that can be fixed without destroying the the basic principles.
NOTES
1. Peloton density p is based on:
- p = mass/vol. Mass = 75kg (rider plus bicycle), multiplied by number of cyclists;
-
Volume = 150m^3 based on a selected area 10m x
10m (a standard road width) x 1.5m (~height of slightly crouched cyclist on
bicycle). -
Here, assuming 70 cyclists in a 100m^2 area, density is 50kg*m^3 (1
cyclist for every 70cm of space laterally for ~14 across, and 1 for
every 185cm lengthwise, for ~5 lengthwise).
2. Relative-passing-speed = (passing-speed) - (mean-peloton-speed)
- equivalent to delta x (distance displacement) in the standard viscosity equation
3. Side-area A = 12.4 + 12.4 * (14 ^ peloton-convergence-ratio), based on:
-
~1.5m (height of crouched cyclist) * 1.65m (length of bike
from tip of front wheel to outside tip of rear wheel), multiplied by the number of
cyclists comprising the length of the single-file perimeter line, here 5.
-
Number of cyclists in single-file (5), is determined by 10m length
(10mX10m grid) / 1.65m (bike length) + 0.20m (approx spacing between
wheels).
-
14 is the number of cyclists laterally who can fit in a 10m space,
given shoulder width of 0.50m, and 0.20 spacing between cyclists
side-to-side, for 10m/0.7m
-
exponent PCR, where PCR is <1, means that A increases
proportionately to increasing PCR; i.e. as PCR increases and riders
approach their maximum sustainable capacities, the peloton naturally
stretches; Where PCR > 1, it means riders become de-coupled.
4. lateral-distance = 10 - 9.5 * (Peloton-convergence-ratio);
-
10 is 10m, or the maximum width of the peloton and maximum density,
in this illustration;
-
since one rider at shoulder width is ~0.5, the minimum width of the
peloton is one-rider wide, or 0.5, so this is set so when PCR = 1,
peloton cannot be less than 0.5m wide, and so the lateral distance
diminishes proportionately to PCR, starting at 9.5m.
-
In order to correspond with PCR=1 and for the Reynolds number to
show negative values if PCR > 1, I’ve set this so that when there is
0 lateral distance, it means the peloton is stretched to a
single-file line (I could have set this so that PCR = 1 when the
peloton was 0.5m wide (one rider wide), but then Reynolds number
stays positive until lateral distance is 0).
-
passing is relative-passing-speed, which equals passing-speed -
mean-peloton-speed
where:
-
Pfront is the power output of the front rider at the given speed
(the same power output that would be required by the drafting (following)
rider to maintain the speed set by the front rider,if the following rider was
not drafting - hence “required output”;
-
D is the percentage of energy saved by drafting, here estimated as
1% per mile/hour (see computer code for conversion);
-
Pmso is the maximal sustainable output of the drafting cyclist.
6. Average-effective-pedal-force, based on:
- rider power-output / pedal velocity of 1.78 m/s, where vp = cadence * crank-length * 2pi / 60 / 1000 using 100rpm, 170mm cranks;
References
[a] Serway,R. 1996. 4th ed. Physics for Scientists & Engineers with Modern Physics. Saunders College Publishing, Philadelphia[1] Serway,Raymond and Jerry Faughn. 1989 2nd. ed. College Physics. Saunders College Publishing, Philadelphia
[2] Trenchard, H., Richardson, A., Ratamero, E., Perc, M. 2014. Collective behavior and the identification of phases in bicycle pelotons. Physica A 405 (2014) 92-103.
[3] Trenchard, H. 2013. Peloton phase oscillations. Chaos Solitons & Fractals. 56 (2013) 194–201(56):194-201.
[4] http://en.wikipedia.org/wiki/Temperature_dependence_of_liquid_viscosity
[5] http://www.research-equipment.com/viscosity%20chart.html
[6] http://catdir.loc.gov/catdir/samples/cam031/00053008.pdf