A couple of quick updates.
Our paper: Trenchard, H.. Richardson, A., Ratamero, E., Perc, M. "Collective behavior and the identification of phases in bicycle pelotons" will be published in a physics journal called Physica A.
http://www.sciencedirect.com/science/journal/03784371
We're not sure yet in what issue the will be included, but I am anticipating a summer issue, possibly as early as June.
I will also be attending the MIT Collective Intelligence conference in Boston, June 10-12, where I will present an overview of this paper.
http://collective.mech.northwestern.edu/
I will likely make a submission to a conference in workshop in Vancouver Evolutionary computation (EC) and multi-agent systems and simulation (MASS), which is part of the Genetic and Evolutionary Computation Conference (GECCO-2014). This would be a simple demonstration of our positional-change method using Netlogo.
https://sites.google.com/site/ecomassworkshop/
It looks like I can acquire some continuous overhead footage of Stage 5 of the Volta Algarve. I am hopeful that footage will be good enough to make further publishable findings.
Saturday, March 8, 2014
Thursday, November 21, 2013
A Peloton Palette
In August I took video of a number of track races at the B.C. Provincial championships. I was able to get very good video of two races in particular, the women's points-race, and the women's scratch race.

Figure 1. Women's points race. 2013 B.C. Provincial championships
The two graphs below contain data from the women's points race. The top graph shows the positional changes for each of fourteen cyclists; the lower graph shows peloton speed.
The values on the left indicate the relative position of the rider: the closer to 1, the farther toward the back of the pack the cyclist is. The closer to 0, the closer to the front the cyclist is. So, we can imagine the pack as facing downward on the page. Ignoring the letters at the top for now (which indicate peloton phases, which I do not discuss in this post), we can see that regions where curves are most dense are periods when there was high positional change among the riders. The regions where curves are straight and horizontal are periods when the riders maintained stable positions (i.e. they "held" their positions during these periods).
The graph tracks very nicely how riders within the group shifted their positions relative to each other, determined simply by counting the number of riders ahead, not counting riders directly beside each other, divided by the total for a ratio <1. It is a very useful method of indicating phases of peloton dynamics. The graphs combined are a very nice static representation of an entire race, and if we follow each curve individually or pick one or two at random, we get a good sense of how they moved in the pack over the course of the race.

phases (not discussed in this post). The squiggly arrow at the top shows a rider who had been lapped.
Now below is a positional change graph for 16 cyclists from my Peloton 5.5. simulation. (See Figure 8 for an enlarged view of a typical simulated peloton). We can see similar regions of high positional change and periods of stability. Here the periods of stability are comparatively long-term.

Figure 3. Positional change for 16 simulated cyclists (PCR .49) for roughly 7 minutes of run time.
For context, below is a graph tracking one single cyclist's positional change looks like. The circle shows the cyclist being tracked, and the red graph in the middle shows its positional change over time. The curve shows how the rider started near the front of the group, gradually shifted toward the back, and then gradually shifted toward the front again.

Figure 4. Tracking positional change of one simulated cyclist. There are 200 simulated riders in the
peloton above. Red curve shows positional change of rider in circle.
peloton above. Red curve shows positional change of rider in circle.
Below is a similar graph tracking 50 of 60 simulated cyclists. It is much richer, and again we can clearly see regions of high positional change and period of stability, as well as mixed phases.

Figure 5. Positional change for 48 simulated cyclists.
To me it is somewhat reminiscent of a Jackson Pollock abstract painting, perhaps a little like the one in Figure 6. Interestingly, Jackson Pollock paintings have been found to contain fractal patterns. Here is a link to Marcus du Satoy's discussion of this topic. http://www.youtube.com/watch?v=sDXMRN2IZq4
Figure 6. Jackson Pollock painting
In Figure 5 and 7 (below), we may consider mixed phases as containing "eddies", in that there are subsets of cyclists within the group who are exchanging positions, while others are holding their positions. There are gaps in the graph, which indicate regions when riders were side-by-side. As in the real life graph (Fig 2), when cyclists were directly side-by-side, they were not counted as being ahead or behind. So side-by-side riders have the same position value - these appear as "holes" is in the graph. Where we see regions of long-range diagonal movement among most of the cyclists, this indicates whole peloton rotations, much like the convection pattern I have spoken of in previous blogs, and as Erick Ratamero presented evidence for in his paper (3).

Figure 7. Positional change for 50 of 60 cyclists, roughly 10 minutes of run time. Note the clear transitions
between periods of high positional change periods of stability.

Figure 8. Enlarged view of typical peloton from my Peloton 5.5
model (version slightly modified from that presented in my paper "Peloton phase
oscillations"
I believe we are bound to see similar kinds of patterns and transitions of high positional change and low positional change in a large variety of collective phenomena. What palettes of positional change may we find among other such collectives? Where else will find the Jackson Pollocks of nature, embedded deeply within the patterns of collective interaction?
Of particular interest to me of course are American coot collectives, and I hope to do some additional research regarding coots this winter. The challenge for natural collectives like coots, or flocks of starlings or geese, for example, is in obtaining video or other data that can be accurately analyzed for positional change among flock members. Not easy among three dimensional flocks from great distances, but possible with the right conditions.


References
1. Marcus du Satoy http://www.youtube.com/watch?v=sDXMRN2IZq4
2. Pollock, Jackson. 1952. "Blue-Poles" http://www.dailyartfixx.com/tag/jackson-pollock/
3. Ratamero, Erick. 2013. MOPED : an agent-based model for peloton dynamics in competitive cycling
In: International Congress on Sports Science Research and Technology Support, 2013, Vilamoura, icSPORTS 2013
4. Trenchard, H. 2013. Peloton phase oscillations. Chaos, Solitons and Fractals: the interdisciplinary journal of Nonlinear Science, and Nonequilibrium and Complex Phenomena, pp. 194-201
5. Trenchard, H. American Coot Collective On-water Dynamics. Nonlinear Dynamics, Psychology, and Life Sciences, Vol. 17, No. 2, pp. 183-203.
Thursday, November 14, 2013
Video demonstration of Peloton 5.5
In the video link below I discuss and demonstrate my Peloton 5.5 model, using Netlogo. The model includes a few refinements over the version I presented in my recently published paper [1]. In that paper I apply my “peloton convergence ratio" (PCR) equation and examine peloton phase changes as a function of fractions of PCR. In that paper I also incorporate a “passing principle” whereby I suggest that when there is a significant power output differential between front and drafting riders, it is inevitable that drafting riders with greater relative energy stores will pass those ahead, but this passing capacity falls as riders approach maximal sustainable outputs.
In a subsequent post I hope to discuss a recent peloton model created by Erick Ratamero (University of Warwick), which he presented at a conference in September. He, myself, and Ash Richardson (University of Victoria), are in the stages of preparing a collaborative paper in which we look at the data I've obtained from two track races at the recent B.C. track championships.
In Peloton 5.5 I break down PCR into its constituent elements: a fixed power output for a front non-drafting rider, a variable drafting rate -- which returns a correspondingly reduced power output for drafting riders relative to a riders in front positions -- and a variable MSO (“maximal sustainable output”). I set an arbitrary output for the front rider, and allow the other variables to be adjusted returning a PCR that describes the output relationships between the front and the following riders.
With this I demonstrate two extreme peloton phases: the low-density stretched phase in which PCR approaches 1 in which little or no passing occurs, indicating that the power output of the following rider approaches her maximal sustainable output; a high density, high passing phase in which PCR is closer to zero. I then go on to show mid-range of PCR in which we see oscillations between phase states as well as simultaneous occurrences of them.
http://www.youtube.com/watch?v=-gmy520EEW4&feature=youtu.beIn a subsequent post I hope to discuss a recent peloton model created by Erick Ratamero (University of Warwick), which he presented at a conference in September. He, myself, and Ash Richardson (University of Victoria), are in the stages of preparing a collaborative paper in which we look at the data I've obtained from two track races at the recent B.C. track championships.
Trenchard, H. 2013 Peloton Phase Oscillations. Chaos, Solitons and Fractals: the interdisciplinary journal of Nonlinear Science, and Nonequilibrium and Complex Phenomena, pp. 194-201
Monday, September 9, 2013
Geology in Motion: Tour de France and the dynamics of bicycle pelotons
Here is a link to a blog post by Susan Kieffer, in which she summarizes an earlier paper of mine:
Geology in Motion: Tour de France and the dynamics of bicycle pelotons
Her blog is also great and very interesting, I might add.
Geology in Motion: Tour de France and the dynamics of bicycle pelotons
Her blog is also great and very interesting, I might add.
Sunday, September 8, 2013
Finally, a published paper; recent tweaks to my model, and current plan for next paper.
At last I have a paper published in an academic journal. The online version can be found in the link below, while the hard copy version is out in November, it appears. It is included in a special issue "Collective Behavior and Evolutionary Games", edited by Matjaz Perc and Paolo Grigolini.
Full citation: Chaos, Solitons and Fractals: the interdisciplinary journal of Nonlinear Science, and Nonequilibrium and Complex Phenomena (2013), pp. 194-201 DOI information: 10.1016/j.chaos.2013.08.00

However, in image B, below, I lowered the drafting rate. This has the effect of bringing the power output of the following rider closer to that of the front rider, and hence PCR increases toward 1 (see the steps on the green line for the power output of the drafting rider, and the corresponding step up in PCR). Notice how the peloton begins to stretch (also see the red line on the graph "Peloton Length"), and see the corresponding drop in positional change. The decrease in positional change means it is getting more difficult to pass.
B.
In image C below, I dropped the drafting rate a bit more. As noted, this brings the power output of the drafting rider closer to the output of the front rider, and increases PCR. Notice how the positional change dropped at one point dramatically, and then began to fluctuate. Here, because the world "wraps" around in a cylinder, as the peloton stretches, riders get "lapped" fairly quickly. This is largely why we see the significant jumps in the positional change values, although in the appropriate PCR range we also see self-organized oscillations, where stretching and low positional change occurs for certain periods, followed by increased density and higher positional change, and so the cycle continues for unpredictable durations.
C

So, this summarizes the result of my paper, although these recent tweaks connect the simulation even more clearly to the actual physical parameters we see in pelotons: drafting rate, power output of drafting rider relative to front rider, and riders' maximal sustainable outputs. These recent tweaks confirm the results of the published paper.
My plan at this point is to gather some data from video footage I took of some mass-start events at the Provincial Track championships, and to demonstrate how rates of positional change show phase boundaries.
Of course I would also like to show how these principles apply to other natural biological systems. The logical next place for me to look for this is American coot formations, since I have already seen and documented similar formations. The underlying mechanism for coot formations remains a hypothesis only, but this simulation itself should have, I think, applications in many different systems.
Full citation: Chaos, Solitons and Fractals: the interdisciplinary journal of Nonlinear Science, and Nonequilibrium and Complex Phenomena (2013), pp. 194-201 DOI information: 10.1016/j.chaos.2013.08.00
In the paper I refer to my Netlogo model, which simulates the peloton as it oscillates between two primary phases: a low power output phase, and a high power output phase. I show how the peloton changes its pattern formations as a result of these collective power output changes.
After submitting that paper, I made a few tweaks to my model. The changes were small but resulted in increased realism. Also, instead of simply using what I call the "peloton convergence ratio (PCR)" as the main tunable parameter, I use other parameters which are incorporated into an actual equation that produces the PCR. Also, I included a new graph to show positional changes, which is an important indicator of the phase boundaries. Here a "phase" is simply a distinctive collective pattern formation. As cyclists know, peloton pattern formations are constantly changing, and hence "phase changes" and "transitions" between phases.
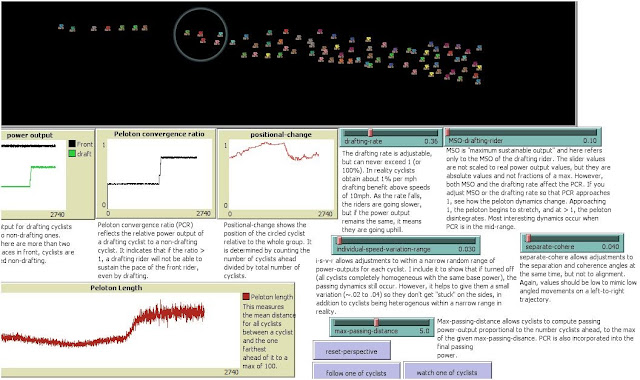
To illustrate, look at image A, below. I've set the drafting range and maximal sustainable output ("MSO") parameters (two blue sliders immediately below the black "road") such that when they combine (i.e operate according to an equation) they produce a certain Peloton Convergence Ratio, or PCR, (second graph from the left). In this case the PCR is comparatively low.
Note that the graph on the left shows the power output of a front rider (black line), while the green line shows the power output of the drafting rider.
At this comparatively low PCR, the positional change is high, meaning the riders rotate positions frequently. This is realistic because the drafting rate is high and drafting riders are well "rested" for passing those in front. This would characterize a high density phase, low PCR phase.
A.

However, in image B, below, I lowered the drafting rate. This has the effect of bringing the power output of the following rider closer to that of the front rider, and hence PCR increases toward 1 (see the steps on the green line for the power output of the drafting rider, and the corresponding step up in PCR). Notice how the peloton begins to stretch (also see the red line on the graph "Peloton Length"), and see the corresponding drop in positional change. The decrease in positional change means it is getting more difficult to pass.
B.

In image C below, I dropped the drafting rate a bit more. As noted, this brings the power output of the drafting rider closer to the output of the front rider, and increases PCR. Notice how the positional change dropped at one point dramatically, and then began to fluctuate. Here, because the world "wraps" around in a cylinder, as the peloton stretches, riders get "lapped" fairly quickly. This is largely why we see the significant jumps in the positional change values, although in the appropriate PCR range we also see self-organized oscillations, where stretching and low positional change occurs for certain periods, followed by increased density and higher positional change, and so the cycle continues for unpredictable durations.
C

So, this summarizes the result of my paper, although these recent tweaks connect the simulation even more clearly to the actual physical parameters we see in pelotons: drafting rate, power output of drafting rider relative to front rider, and riders' maximal sustainable outputs. These recent tweaks confirm the results of the published paper.
My plan at this point is to gather some data from video footage I took of some mass-start events at the Provincial Track championships, and to demonstrate how rates of positional change show phase boundaries.
Of course I would also like to show how these principles apply to other natural biological systems. The logical next place for me to look for this is American coot formations, since I have already seen and documented similar formations. The underlying mechanism for coot formations remains a hypothesis only, but this simulation itself should have, I think, applications in many different systems.
Monday, July 8, 2013
Lessons from the Peloton - short video
I prepared this last year, and am only now adding a link to it here.
I prepared this last year, and am only now adding a link to it here.
Tuesday, July 2, 2013
What is a peloton? Article in the Metchosin Muse
The following article of mine was published in the July/August issue of the Metchosin Muse (excuse the overlap). A more readable copy of the text follows (with a few minor edits from the printed version), following the article copy.


What is a peloton?
By Hugh Trenchard
Metchosin Muse Vol. 21 Issue 7/8 (July/August 2013) p.13
photo and caption by Brian Domney
________________________
If you did not know what it was, from a distance and the right
vantage point, it may appear as a gigantic amoeba that covers the width of the
road, or like a snake that stretches 300 metres long. Perhaps it is some
unknown creature: it proceeds as an amorphous mass that shifts across the road,
expanding and collapsing like an accordion. As it nears, whirring sounds and
grunts are carried on the wind. Soon helmets may be discerned with the sun
glinting off wheels and frames; then you may see spandex and turning legs,
brown and muscled like horses. This is not an alien creature at all, but
a peloton, or a group of cyclists in a bicycle race.
Every cyclist in the peloton races with some tactical or
strategic objective in mind. However, at a more primitive level, each must be
vigilant to avoid crashing into their neighbors, while keeping up speed with
the group and adjusting their positions for the sweet spot where pedalling is
easiest. If a cyclist shifts too far toward the back, she will know that the
race is lost if she remains there until the finish, and so must constantly
fight to stay near the front.
At this basic level, cyclists’ actions are determined by their
responses to nearest neighbors, and by principles of physics, physiology and
simple objectives. Viewed this way, a peloton is very much akin to a
flock of birds, or school of fish, or an ant colony. And for scientists who
study them, animal
collectives and biological and human systems like these are interesting because
complex patterns emerge from simple underlying rules of behavior.
In
biological systems like these there are no leaders to command the
positions of others within the group or how to go about their
activities. When patterns form without leaders, these patterns are
said to self-organize, or to be "bottom-up" processes. In starling
flocks we see amazing displays of self-organized shape and structure. On the West
Coast we are all familiar with the precise, self-organized v-formations of
geese. So too do we see similar structures and patterns in fish schools. In ant
colonies, individual ants are not very smart, but sophisticated self-organized
social behavior emerges when they interact according to a small set of basic
rules.
A bicycle peloton is especially interesting because self-organized patterns
emerge from basic human or physiological principles, while at the same time
there are also leaders who may control the pace or command team-mates to alter
their positions in the peloton. These leader-driven factors of bicycle racing
are "top-down" in nature.
Self-organized peloton pattern formation is driven by three
primary rules: avoid colliding with your neighbors, save energy by drafting
(riding behind others), and advance toward the front. We can see the
first two of these are clearly universal principles, since we know how birds
must avoid collision to stay aloft, and how their v-formations allow them to
save energy and enhance their long-flight capabilities.
Some may argue that the third principle, the
"front-position imperative" is not a universal biological principle,
but is really the result of the competitive nature of a human-designed bicycle
race and the objective of winning the race. However, we do actually see this
kind of competitive drive in nature. For example, sperm engage in a similar competition
for the front of the group and, as is commonly known, only one sperm will
impregnate an egg. Or, for a herd where food and water are scarce, the
individuals who arrive at them first will survive, necessitating a competition
for those resources. We can also imagine herds being chased by predators, where
those individuals within the herd which advance to positions farthest from the
predator are more likely to survive.
When we look at flocks, schools, or herds, it is not hard to see how they
undergo changes in pattern formation. Some of these are changes in density, or
how closely animals pack together. Some may be changes in alignment and
direction, or speed. Changes in formation may be said to undergo phase changes,
like those when water freezes to ice, or when water boils to steam. It
may seem obvious that this is what animals do, but the answers are not as
obvious when you begin to explore why animals move collectively in the ways
they do.
Pelotons are accessible for studying all manner of collective behavior because
we can obtain data about human physiological requirements, observe and track
individuals who comprise the formations we see and correlate positional data
with physiological data. Of course we can also learn from the riders themselves
about their experiences. By contrast, it is not so easy to ask a goose how hard
it was to keep up with the flock that brutish day in the howling headwind. But
by learning about what cyclists do, so may we understand more about what
starlings do, or what fish do, or what ants or huddling penguins do.
But the riches of peloton dynamics do not end there. There are
other avenues of exploration as well. These studies fall within the domain of
complex systems theory. Originally a branch of physics, it has grown in recent
decades to be multi-disciplinary in scope, encompassing such disparate fields
such as sociology, evolutionary biology, economics, ecology, and vehicle traffic
flow. By studying the amorphous oscillations of the peloton, we stand to
gain insight into all of these areas.
Subscribe to:
Posts (Atom)