Saturday, August 29, 2015

The peloton superorganism and protocooperative behavior - a brief overview


My latest paper The peloton superorganism and protocooperative behavior is published at last. Obviously any published paper requires a lot of work, but for me this one has required the most so far. I began writing this in late 2014, and it was accepted for publication in early August 2015 after the usual process of review and revisions. I would like to think that while this one was more work than my previous papers, it will have the most impact.

I. Protocooperative behavior

Basically the paper argues for a new concept that I call "protocooperative behavior", or PB for short. While the evidence I present is in relation to bicycle pelotons, I suggest that it applies to any biological system in which there is some energy savings mechanism, such as may be found in bird flocks, or fish schools, among others.

Two phases of PB

PB is defined by two phases of behavior: a phase in which cyclists (or other organisms) proceed at a sufficiently low output or speed for cyclists to pass each other and to share the most costly front position(s); a second phase in which cyclists can maintain the speeds of stronger front riders, but cannot pass them. In the low speed phase, the peloton is high density, and in the higher speed phase, the peloton is stretched in single file. At a second threshold, cyclists decouple and diverge.

Phase 1: Low speed, passing and cooperative sharing of costly position

In the low-speed phase, cyclists can pass because to do so is well within their metabolic capacity. To simulate passing, simulated cyclists are programmed to accelerate randomly within a range of speeds up to their maximum capacities. In this low speed phase, cyclists naturally share the most costly high-drag front positions.


Phase 2. High speed, no-passing, free-riding phase

As speeds increase, cyclists' capacity to pass diminishes until a threshold is reached when they cannot pass at all, yet they can still keep pace with stronger riders ahead (the stretched phase). This is possible due to the power output reductions afforded by drafting. In the stretched phase, cyclists are free-riders by physiological necessity, not by choice.


Individual and team strategies need not be modeled

These behaviors -- passing behavior/ sharing the most costly front position, and maintaining speed of stronger rider while being unable to pass -- need not be modeled by strategic probabilities or game theory. The behaviors self-organize from principles of energy savings, cyclists' maximal capacities, their current output, and a deceleration parameter that is triggered when cyclists are effectively driven over their maximal outputs. This is one of the main features that distinguishes this model from more standard models of cooperative behavior; i.e. no strategies are introduced into the model to generate cooperative behavior.

In that vein, team dynamics are not modeled, so circumstances in which teams might dominate the front at low speeds are not considered. This is important because, in natural biological collectives, we are more likely to see random passing based on inherent natural capacities, and less likely to see "teams" motivated by some tactical reason to dominate given positions. We may see something like that in nature, but I suggest such team-like domination would be observed among a comparatively advanced evolutionary stage than the primitive dynamics I am modeling.

The threshold between the phases

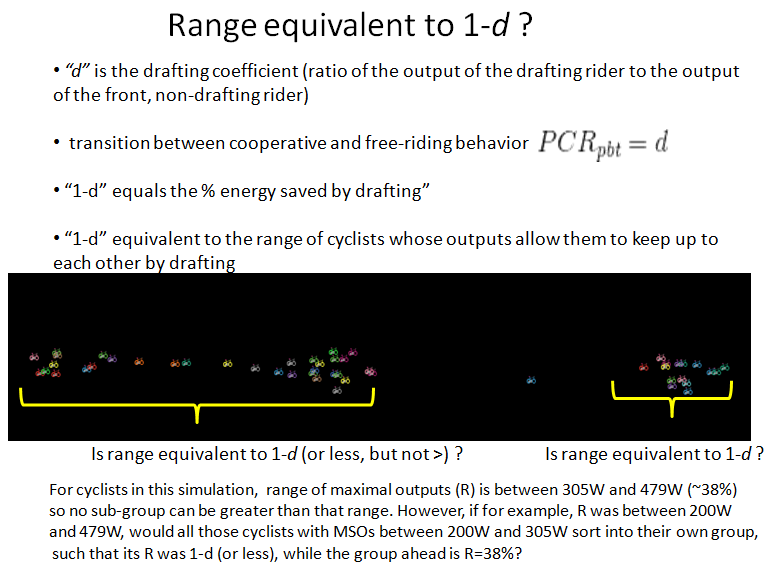
There is a clear threshold between a high-density passing phase, and a stretched phase. This threshold is demarcated by the equivalent of the coefficient of drafting. My paper sets out the details of how this works, but simply put, it is a function of the relationship between the coupled outputs of the cyclists, their maximum capacities, and the energy saved by drafting. I illustrate the transition here:

Figure 1. The protocooperative behavior threshold (pbt), approximately equivalent to the coefficient of drafting (d). See paper for details relating to "PCR" and Figure 2; Appl. Math and Computation Vol. 270, 1 Nov.  2015, Pages 179–192.


Cyclists sorting into ranges of output capacities

Additionally, cyclists (or any organism) exhibit a heterogeneous range of maximal outputs (i.e. they are not all the same). If the range of outputs is sufficiently broad, when the strongest riders drive peloton speeds to near maximums, the peloton tends to sort into subgroups in which the range of outputs is equivalent to the energy saved by drafting. My paper details why this is so.  Below I illustrate the group sorting hypothesis.

Figure 2.  Illustrating group sorting where, after speeds are driven to maximal speeds by the strongest riders, the range of maximal capacities within groups corresponds to the energy savings quantity.

II. Significance 

1. The two phases of PB and the threshold between them suggests a primitive form of cooperative behavior that does not rely on any evolutionary strategy (hence "proto" cooperative behavior) -- this proto-behavior may precede other evolutionary mechanisms for cooperation, such as kin selection, reciprocity and others; i.e. it is simply a function of changing speeds and organisms' outputs, coupled by an energy savings mechanism.

2. In its most primitive form, cooperation can't occur unless group members are below a critical threshold of outputs; i.e. they must have some spare energetic resources before they can cooperate, a la the quote from Roosevelt in the paper. So, if resources are strained such that group members are taxed to their physical limits, they will not physically be able to cooperate. This suggests that cooperation evolves in circumstances of "luxury".

As discussed,  the critical threshold for "luxury" corresponds to the variation range of maximal outputs that corresponds to the energy savings quantity (1 - d, where d is the energy savings coefficient): when organisms operate below this output threshold, they can cooperate; when above it they can free-ride, but cannot cooperate (Figs 1 and 2), up to a second de-coupling threshold.

So, as group member outputs are increased (and by similar process, resources become scarce), fewer and fewer among the group are within their limits of "luxury" and capable of cooperation; i.e. the strongest cooperate, while the weaker engage in free-riding behavior. Conversely, as outputs fall, or resources become more abundant, cooperation tends to be more widespread, even if it is less necessary for the survival of the group.

I have not researched the literature to find support for this, but it may be seen to be somewhat at odds with some current thinking -- for example, the "ecological constraints hypothesis" suggests that cooperative parenting occurs when resources are scarce [1] rather than when resources are more abundant, as I have suggested. While I need to study the literature a lot more, there may not be an inconsistency at all: what we may be seeing in circumstances of ecological constraint are situations when cooperation is narrowed to the stronger members of the group, while there is an increase in the number of free-riders. So, as a simplistic illustration, the weaker, young members may be fed by the cooperating stronger "parents" for an increased period of time (greater free-riding) before the young are permitted to feed on their own.

3.  In some models, such as that of Aviles [2], a cooperation parameter, y, is introduced which, when adjusted, generates different kinds of collective behavior.  However, at least insofar as [2] is set out, there is little or no explanation of what criteria are required to adjust the y parameter.  The peloton model suggests criteria for tuning that parameter as a function of individual maximal capacities, current outputs, and the energy savings quantity.

4. By modeling a mechanism for group sorting and the resulting range of differences among members of each group, we have a testable mechanism for niche formation, speciation, and group heterogeneity.

Although I didn't say this directly in the paper, here I go so far as to suggest that many branches in the evolutionary tree can be traced to this sorting mechanism. The model suggests an evolutionary mechanism that permits for the shedding of weak group members who are therefore readily susceptible to predators, or who become isolated and lose the opportunity to reproduce.  Where whole groups divide and separate, members of each may reproduce, but possibly in very different environments; e.g. one group might "make it over the Himalayas" (thank-you Ross Hooker for the illustration) into the rain-forest, while another may may end up in the high mountains. Indeed it may be possible to show mathematically how the entire range of differences among all existing species conforms to energy savings quantities at critical group sorting points. This would not be an easy task by any means, but it would have to begin with identifying the various energy savings mechanisms enjoyed by different organisms, and the energy savings quantities.

Of course, it is not necessarily true that all biological collectives enjoy energy savings mechanisms. In fact a recent study that shows pigeon flocks involve increased energetic costs due to positional adjustments especially during turning motions [3]*.  Still, it is apparent that such mechanisms do appear in many species. Even collections of bacteria tend to move faster than individuals [4] which suggests an energy savings mechanism.

In terms of other applications, there are other types of energy savings mechanisms. For example, any sort of leader-follower situation involves some sort of energy saving for the follower. The person who tramps snow first saves energy for the follower; the person who cuts through the forest makes it easier for those who come after.  A teacher saves a student energy because the student does not have to reinvent the wheel, as it were. These are but a few examples. While PB and group sorting for such situations may be more complicated, it is open to consider how the principles I present may be broadly applied.

[1] B.J. Hatchwell and J. Komdeur  Ecological constraints, life history traits and the evolution of cooperative breeding. (2000) 59(6):1079-1086.
[2] Aviles, L. "Cooperation and non-linear dynamics: An ecological perspective on the evolution of sociality." Evolutionary Ecology Research (1999), 1: 459-477
[3] Usherwood, James R., et al. "Flying in a flock comes at a cost in pigeons."Nature 474.7352 (2011): 494-497. 

[4] Cisneros, Luis H., et al. "Dynamics of swimming bacteria: Transition to directional order at high concentration." Physical Review E 83.6 (2011): 061907.  http://www.physics.arizona.edu/~kessler/micro/PhysRevE.83.061907.pdf


* Usherwood et al. seem to focus on energetic costs incurred in banking and turning, as they demonstrate in this video: https://www.youtube.com/watch?v=ssUslfD47l0. I've observed pigeons to fly several km at a stretch in roughly mean straight trajectories, and there are pigeon races over hundreds of km, meaning they are capable of long flight: https://en.wikipedia.org/wiki/Pigeon_racing.  I would be interested to see if the same principles of increased costs in flock formations apply in these circumstances. 


Thursday, July 30, 2015

Friday Harbor laboratories presentation


I was privileged to receive an invitation from Dr. Paolo Domenici to give a peloton dynamics presentation
at the Friday Harbor Laboratories (University of Washington) on San Juan island. The opportunity was serendipitous given how near San Juan Island is to Victoria.

Monday, December 29, 2014

Peloton hysteresis revisited


In analyzing peloton dynamics, an area ripe for exploration involves the mechanics of peloton density as it stretches and compresses. Speed and power output changes are obvious underlying mechanisms for these oscillations, but there are other more subtle dynamics at play. Among these subtleties are lags or delays in the transitions between density oscillations which are characteristic of hysteresis effects.

There is more than one type of hysteresis, but the general category of hysteresis I consider involves a lag between system input and output [1], meaning there is an asymmetry between a system trajectory, such as acceleration, and its complementary trajectory, such as deceleration. The following description, made in the context of vehicle traffic [2], well describes hysteretic behavior in pelotons:

"The dynamics of traffic flow result in the hysteresis phenomenon. This consists of a generally retarded behavior of vehicle platoons after emerging from a disturbance compared to the behavior of the same vehicles approaching the disturbance."

In a 2010 conference paper "Hysteresis in Competitive Bicycle Pelotons" [3] I proposed three different types of hysteresis in pelotons. Below I re-state and re-categorize them, hopefully with better clarity. In the 2010 paper I referred to "flow" to describe changing peloton density to be consistent with vehicle traffic models, but it is more intuitive to refer to compression (increase in peloton density) and stretching (peloton lengthening).

Types of peloton hysteresis

I.    Where a peloton decelerates relatively rapidly with corresponding rapid compression, followed by a proportionately longer acceleration time and peloton stretching. There are two sub-types:
  • A: occurs with corresponding changes in speed and power output preceding the disturbance and after it, such as slowing before a corner and accelerating out of it;
  • B: occurs with corresponding changes in speed but where power output may be approximately retained, such as when peloton compression and deceleration precede a climb and stretching occurs during the climb, but power output is roughly constant before and during the climb.
II. Where a peloton accelerates rapidly with corresponding stretching effect, followed by increased stretching  even as speeds decrease.

III. Inversely to II, where a peloton decelerates rapidly with corresponding compression, following by an increase in speed where compression either continues to increase for a short period or is temporarily retained even as the peloton accelerates.

For the purpose of this post, I am primarily concerned with types II and III.

Figures 1 & 2 below are re-scaled images from my 2010 hysteresis paper. Figures 3 & 4 show data from indoor velodrome races I videoed a couple of years ago.  Figures 1 - 4 involve speed data that is generated by the front rider in the group, which speed is applied to the entire group.

In Fig 1, the circled area and arrows show a period of decreasing speed following a rapid acceleration with a corresponding increase in stretching. In Fig 2, the arrows show the direction of the hysteresis curve as speed drops even as the peloton continues to stretch. The short arrow pointing down and slightly to the right (Fig 2 speed-stretch curve) is the hysteretic period of deceleration accompanies by increasing stretch. This direction in the speed-stretch trajectory characterizes Type II hysteresis. This indicates a lag or delay in the system's return to a compressed state as deceleration occurs. If the system dynamics were symmetrical, one would expect compression to accompany deceleration immediately, but we can see that is not necessarily the case. This delay is explainable by cyclists' collective fatigue and a recovery period following high acceleration. I refer to this fatigue induced delay in density oscillation as competitive hysteresis. This is the defining feature of type II peloton hysteresis.


Figure 1 independent speed and stretch curves
Figure 2 speed-stretch curve


Figures 3 & 4 below show another example of Type II hysteresis from a 3km indoor mass-start race (red arrows). Increasing stretch follows a double-whammy acceleration (the two sharp spikes preceding the arrows). Following the first of these accelerations to about 48km/h, there is deceleration and corresponding compression, as one would expect. After the second acceleration "whammy" there is the characteristic Type II down-and-to-the-right trajectory in system dynamics, as shown in Figure 4 (red arrow), indicating deceleration accompanied by increased stretching.

Figures 3& 4 also show an example of Type III hysteresis (green). Following soon after the Type II period, there is a period of increasing speed and increasing compression (Fig 3, green arrows), characterized by an up-and-to-the-left trajectory (Fig 4, green arrow) in the speed-stretch curve. This may occur when there is an acceleration from cyclists toward the rear of the peloton who pass riders ahead. In this case the hysteretic lag is in the return to a stretched state.

Type III hysteresis is also a precursor dynamic to the convective phase discussed in earlier papers [e.g. 5].


Figure 3 speed of front rider, and stretch 

Figure 4 speed-stretch

Using the model in [4], I've sought to identify occurrences of Types II and III hysteresis in simulated peloton dynamics.

Similar to the speed data in Figures 1 - 4, Figures 5 & 6 show the speed of the front rider versus peloton density. Speed of the front rider was coded to randomly fluctuate every 60 ticks (equivalent to 60s) within a narrow range, hence the "square" appearance of the speed data, as well as in the speed-stretch curve.  In Fig 6, generally wherever the curve proceeds at an angle it indicates a hysteretic delay. Using Fig 6, it is difficult to trace the direction of the curve which would tell us the hysteretic Type, although we can roughly eyeball regions of both Types II and III in Fig 5.  I've noted two periods of stable front-rider speed versus increased stretching, which appear to be Type II periods (although difficult to know given the speed curve is stable in those regions).

In contrast, Figures 7 & 8 show the mean speeds of all the riders versus peloton density, which is a level of detail that provides a clearer indication of whether there is acceleration or deceleration occurring. These aggregate speeds are easy to trace in simulations, but are a level of detail I have not obtained for any empirical data. This level of detail could be obtained empirically if speed data was obtained individually for each rider and averaged over the course of the race. This sort of data is desirable.

In Fig 7 there are arrows in about the same locations as for Fig 5, and the opposing direction of the aggregate speed curve do suggest that these regions are indeed hysteretic periods, of Type II. While I have not noted a Type III occurrence, the Fig 8 speed-stretch curve winds in all directions rather like the trajectory of a fruit fly, so it seems the simulation captures a fairly continuous but non-linear hysteresis trajectory. A speed-stretch curve of the moving averages of the mean speeds and the stretch might produce visually more apparent looping patterns.

Figure 5 speed of front rider, and stretch

Figure 6 speed-stretch

Figure 7 mean speeds of all riders, and stretch 

Figure 8 speed-stretch 

Where else might this be applied? 

Regarding other types of flocking systems, similar system lags could be tested by accelerating groups to maximal sustainable outputs for specific periods, followed by deceleration periods, in much the same way as demonstrated here for pelotons.

Here I get highly speculative, but I wonder if there are similar kinds of competitive hysteresis processes in bacterial colonies, or perhaps cancer growths, that might reveal vulnerabilities in those systems. I do not know enough about either of those systems even to propose an experimental protocol to test such a hypothesis. It does seem worth looking into further, however, if it has not already been done.  

It further occurs to me that, having mentioned fruitflies, when we look at 3-dimensional fruit fly trajectories, perhaps there is a way to decompose those trajectories into 2-dimensional speed and stretch data. I don't have a good sense of how this would be done at this point, however, and am simply putting the idea out there.

If nothing else, we gain insight into peloton dynamics specifically, and may gain understanding of general evolutionary mechanisms for group formation in a variety of systems and how these systems behave.  

References
1. http://en.wikipedia.org/wiki/Hysteresis
2. Treiterer, J., Myers, J.A. 1974. The Hysteresis Phenomenon in Traffic Flow. In: Buckley, D.J. (ed.), Proceedings of the 6th International Symposium on Transportation and Traffic Theory: 13-38
3. Complex Adaptive Systems —Resilience, Robustness, and Evolvability: Papers from the AAAI Fall Symposium (FS-10-03)
4. Trenchard, H., Ratamero, E., Richardson, A., Perc, M. 2015. A deceleration model for peloton dynamics and group sorting. Applied Mathematics and Computation 251, 24–34
5. Trenchard, H.Richardson, A.Ratamero, E.  Perc, M. 2014. Collective behavior and the identification of phases in bicycle pelotons. Physica A: Statistical Mechanics and its Applications, 405 . pp. 92-103. ISSN 0378-4371


Tuesday, December 2, 2014

A deceleration model for peloton dynamics and group sorting - available online

Our paper:

Trenchard, H., Ratamero, E., Richardson, A., Perc, M. A deceleration model for peloton dynamics and group sorting,  Applied Mathematics and Computation, Volume 251, 15 January 2015, Pages 24–34  is now available online.  Elsevier is allowing general free access until January 21, 2014. Try this link for the temporary free access.

Wednesday, October 29, 2014

Video "Lessons from the Peloton"


I've prepared an 8 minute video Lessons from the Peloton  in which I discuss the concept of group sorting and phase transitions in pelotons. I show my own footage of various bicycle races, flocks, non-biological systems, and other kinds of human organizations.  It's a "popular" video, which I've actually entered as a submission to the Vancouver Island Short Film Festival.  As an amateur videographer, I don't have a good sense of its chances in making it into the festival, but whether the video gets into the festival or not, it helps to explain in a non-technical way some of my own work and interest in the behavior of pelotons.


Tuesday, September 2, 2014

Peloton Anatomy - some updates


Following on an earlier post about sorting dynamics, here I recap generally a few developments with some short demonstrations.

I've incorporated a deceleration algorithm that allows us to show how much a following cyclist needs to decelerate in order to stay at or below his/her threshold if a leading cyclist drives the speed of the peloton too high for the following cyclist. This is a significant development over previous models, one of mine, and one by Erick Ratamero.  Basically, I've incorporated the new deceleration algorithm into Ratamero's model, for a new model.

Ratamero's model is still sound because it models cyclists' overall energy expenditure in peloton conditions, while this new model allows us to see changing peloton dynamics as group speeds change throughout the course of a race. Nor is my earlier model invalidated, since it applied the same basic principle I use in the new model, except that the old model did not apply any actual speed, power or MSO data. That said, while I could defend the basic principles of my old model, we can now essentially discard it in favor of this new model.

To demonstrate the new model, first take a look at the link below of accelerated footage of the 2013 BC Championships women's Points Race. Pay attention to the oscillations between stretching (single-file) and compact formations. The accelerated motion of the video is about 2X normal speed. I hope the "Ride of the Valkyries" background music isn't too distracting!

 Points race - accelerated

Keeping the dynamics of that race in mind, below is a simulated version of the same race, accelerated to about twice as fast again so you can see the whole race occur in a short time. I've incorporated the speed parameters that I derived at two timing places per lap, and encoded it into the simulation.You can see the speed changes according to the power graph to the lower right. When the power output spikes, you can see certain cyclists are forced to decelerate relative to others. When the speed relaxes, the peloton reintegrates and its density increases.  This relaxation oscillation is well modeled by the new algorithm.

The numbers you see on the "backs" of the riders are their "maximal sustainable outputs" (MSOs), or their maximal sustainable power for a duration between 30 seconds and 5 minutes. These are derived from the cyclists' 200m sprint times, and multiplied by a value that reflects their sustained maximum output during the race for between 30s and 5 minutes.

simulated peloton 14 cyclists

With that fairly accurate simulation, we can try some experiments. For example, we can increase the size of the peloton.  Here is a view of 50 cyclists with the same speed profile as for the 14 cyclists above.

simulated peloton 50 cyclists

Now let's take a look at 100 cyclists (link below).  I've only included part of the video here, since the simulation runs slower with 100 cyclists, and the point is made with a slightly abbreviated version.  Quite a bit more impressive, though, to see a much larger group and its dynamics, using the same speed profile as for the original 14 cyclists. What is interesting with 100 cyclists, which is not so easy to see with smaller the simulated pelotons, is that in the position profile graph we can see some evidence of the "convection" dynamic that I have spoken of in previous posts.  It seems that it may be a dynamic that only clearly emerges at some threshold peloton size and speed.  You can see this somewhat for 50 cyclists, but still it seems clearer in runs of 100 cyclists.

 simulated peloton 100 cyclists

I am looking to have the new model published (with the same three collaborators on our last published paper: Richardson, Ratamero, Perc). In this new paper, we will show how the model demonstrates sorting of the peloton into groups, and some results to this effect.

In future, we still need to investigate and report more definitively on the convection dynamic. So that could be the subject of the next paper - or I am also interested in obtaining  some more evidence of the hysteresis effect I observed a few years ago, and presented in principle at an AAAI conference.

I'm also now interested in developing a peloton solution to the tragedy of the commons (ToC),  having been somewhat inspired by Francis Heylighen's recent efforts to show a self-organized solution to the ToC (not yet published).

Of course there is also some fluid dynamics analogies I want to develop, and recently I have been thinking about Stokes Law and particle settling as somewhat analagous to peloton sub-group sorting. Is there some sort of equivalency between the size of a particle moving through fluid, and the MSO of a rider?


Monday, July 21, 2014

Calibrating the simulation


Having made a few adjustments to the newest peloton simulation model, I have produced an excellent simulation result of the women's 2013 BC Championships Points race. 

Figure 1 is a graph of the actual position data from the women's Points race.  There were 14 riders in the race.

Figure 1. Position data from 2013 women's Points race, BC Championships.


In the Netlogo model, I set 14 simulated riders with maximal-sustainable-outputs (MSOs) corresponding to those of the women in the race*.  Using the speed data from that race, I inputted the speeds in the appropriate time sequence into the simulation, corresponding to power values in the second graph from the top in Figure 2 below. This generated the position graph (top graph below). The similarities are quite remarkable, and this is good evidence that the new model is solid.


Figure 2.  Simulation results using data from women's Points race.  14 riders with MSOs corresponding to 200m sprint times. Speeds were input according to data (indicated by power graph), and the outputs are shown by the position graph, PCR, and peloton stretch. Peloton stretch is the distance from the front rider to the rear rider, indicating changing length of the peloton.


*I used the 200m sprint times as the starting point for these. There were three riders in the points race who did not race the 200m TT, and so I used the mean of the other 11 for the missing ones in the simulation.